


When Logistics Data Arrives Too Late
Logistics companies create data at every step of shipments, bookings, quotations, invoices, delivery milestones, customs updates, warehouse movements, and financial transactions. But when this data stays scattered across systems, spreadsheets, and manual reports, management only sees the business after the delay has already happened.
By the time reports are prepared, opportunities may be missed, costs may be hidden, and performance issues may already affect customers.
Zybo BI converts operational and financial data into clear, management-ready dashboards, giving leaders real-time visibility into performance, profitability, exceptions, and trends across the entire logistics business.
What Zybo BI Dashboard Delivers
Centralized BI Reporting
Consolidates operational, sales, finance, CRM, and workforce data into one Power BI reporting environment. Gives management one trusted view of business performance.
Performance Analytics
Tracks total jobs, air KG, TEUs, LCL CBM, revenue, gross profit, GP %, and provision visibility. Helps leadership monitor overall business health, revenue, and profitability.
Salesperson Performance Analysis
Measures revenue, GP, and job volume by salesperson. Improves sales accountability and highlights top-performing sales teams.
Business Channel Analysis
Analyses performance across air freight, sea freight, land transport, storage, cross trade, trading, and console shipments. Shows which service lines are generating volume, revenue, and margin.
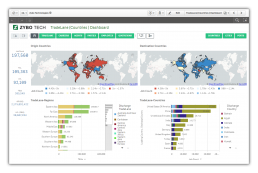
Entity / Branch Performance
Compares performance across entities such as UAE, Saudi, Germany, USA, South Africa, China, UK, and Australia entities. Supports country-wise and entity-wise performance review, global visibility, and strategic planning.
Workforce Volume Reports
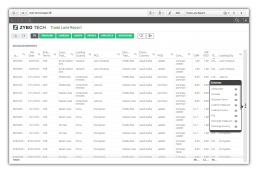
Tracks shipment workload, air KG, TEUs, LCL CBM, shipment category, country, shipment terms, and monthly job trends. Helps management understand operational workload, capacity, and shipment movement patterns.
Workforce Revenue Reports
Connects operational activity with revenue, cost, gross profit, GP %, country profitability, and staff productivity. Helps identify GP leakage, profitable trade lanes, and employee-level productivity.
Agent Volume Analysis
Monitors forwarding agents, destination agents, shippers, discharge countries, and monthly shipment trends. Supports vendor dependency analysis, logistics partner evaluation, and shipment flow optimisation.
Delay in Invoicing Dashboard
Tracks billing delays by entity, operations staff, accounts staff, month, and job volume. Improves billing efficiency, cash flow visibility, and operational accountability.
Payment Request Dashboard
Monitors payment requests, estimated cost, actual cost, supplier analysis, charge descriptions, and accounts workload. Improves vendor payment visibility, cost control, and financial planning.
Leads & Quotation Analytics
Tracks total leads, prospect customers, logged activities, salesperson activity, response status, and follow-up medium. Gives sales and business development teams better pipeline and conversion visibility.
Prospect Customer Monitoring
Tracks high-value opportunities, quotation status, prospect follow-ups, and strategic pipeline visibility. Helps management prioritise future revenue opportunities and monitor business development progress.
Interactive Filters & Drill-Downs
Includes entity, date, salesperson, customer, module, shipment type, country, and service filters. Allows users to analyse data from different business angles without preparing separate reports.
Cross-Report Analysis
Enables comparison of entity performance, customer trends, salesperson KPIs, and shipment movement patterns. Helps teams move from static reporting to deeper business analysis.
Department Ownership Mapping
Defines dashboard ownership across executive management, operations, finance, sales, accounts, and business development. Encourages accountability and regular dashboard adoption by each department.
Management-Ready Dashboards
Supports operational control, revenue visibility, GP monitoring, workforce management, CRM tracking, and financial process monitoring. Helps the company move from reactive reporting to proactive, data-driven management.
How Zybo BI Is Different
Zybo BI does not simply show numbers, it shows where the business is moving.
From shipment volume and workforce productivity to GP leakage, invoicing delays, payment requests, sales follow-ups, and prospect opportunities, Zybo BI connects operational and financial data into dashboards that leaders can actually use.
It gives every department the visibility they need: operations can monitor workload, finance can track billing and cost control, sales can follow pipeline activity, and management can see profitability across entities, customers, services, and teams.
The BI deliverables document positions Zybo BI as a centralized Power BI analytics framework covering operations, sales, finance, CRM, and workforce activities, with dashboards for performance analytics, workforce volume, workforce revenue, agent volume, invoicing delays, payment requests, leads and quotations, and prospect monitoring.
Why Choose Zybo BI Dashboard
Built for Logistics Operations
Dashboards are designed around freight KPIs such as jobs, air KG, TEUs, LCL CBM, shipment categories, agents, countries, and business channels.
Operations + Finance in One View
Management can review revenue, cost, gross profit, GP %, invoicing delays, payment requests, and job-level cost visibility from connected dashboards.
Not Just Reports — Management Control
Zybo BI helps monitor operational bottlenecks, billing delays, workforce workload, GP leakage, sales follow-ups, and high-value opportunities.
Department-Specific Dashboards
Each dashboard is aligned with department ownership, including executive management, operations, finance, accounts, sales, and business development.
Profitability Visibility
Leaders can analyse GP by salesperson, employee, category, country, entity, business channel, and customer pipeline.
Billing Delay Monitoring
The delay-in-invoicing dashboard highlights delays by entity, operations staff, accounts staff, month, and job volume to improve revenue realization.
Workforce Productivity Tracking
Zybo BI shows workload, shipment volume, revenue contribution, and employee-level productivity, helping managers balance capacity.
Sales & CRM Intelligence
Leads, quotations, follow-ups, response status, salesperson activity, and high-value prospects can be monitored through sales dashboards.
Interactive Drill-Downs
Users can filter by entity, date, salesperson, customer, module, shipment type, country, and service to analyse data from different angles.
From Reactive to Proactive Management
Zybo BI helps companies move away from delayed spreadsheet reporting toward proactive, data-driven decision-making.
Who Uses Zybo BI?
Zybo BI is built for leaders, not just report viewers. Executives use it to see business direction. Operations teams use it to control workload. Finance uses it to reduce billing delays and monitor cost. Sales uses it to track leads, quotations, and customer follow-ups. Branch managers use it to compare performance across entities and service lines.
Executive Management
Reviews overall business performance, revenue, gross profit, entity performance, strategic pipeline, and business trends.
Operations Management
Monitors shipment volume, workload distribution, operational bottlenecks, agent performance, and service activity.
Finance Management
Tracks revenue, GP, invoicing delays, payment requests, cost visibility, and financial process efficiency.
Accounts Team
Reviews billing delays, pending payment requests, supplier costs, accounts workload, and invoice processing performance.
Sales Heads
Tracks salesperson performance, revenue contribution, GP generation, leads, quotations, and customer follow-up activity.
Business Development Team
Monitors prospect customers, high-value opportunities, quotation progress, and strategic sales pipeline.
Workforce Planning Teams
Analyses staff workload, job volume, operational capacity, and employee productivity.
Branch / Entity Managers
Compares performance across countries, entities, teams, and service lines to identify growth and improvement areas.
Make better decisions together
With Zybo BI, everyone can make smarter, more informed decisions, together. No matter how small or large your team, easily share insights and work collaboratively in powerful ways.
Faq
FAQs-Zybo BI Dashboard Module
Zybo BI is a centralized Power BI analytics framework that brings together data from operations, sales, finance, CRM, and workforce activities into interactive management dashboards. It helps leadership monitor performance, profitability, bottlenecks, and business trends from one reporting environment.
Zybo BI includes dashboards for performance analytics, workforce volume, workforce revenue, agent volume, delay in invoicing, payment requests, leads and quotation analytics, and prospect customer monitoring.
Yes. Management can monitor revenue, gross profit, GP %, total jobs, air KG, TEUs, LCL CBM, business channel performance, salesperson performance, and entity-level results.
Yes. The Delay in Invoicing Dashboard tracks delays by entity, operations staff, accounts staff, monthly trend, and job-level delay analysis. This helps improve billing efficiency, accountability, and cash flow visibility.
Yes. Workforce dashboards show shipment workload, operational staff activity, job volume, revenue contribution, and employee-level productivity, helping management understand capacity and performance.
Yes. Sales teams can track leads, quotations, follow-ups, response status, customer prospects, salesperson activity, and follow-up medium such as visits, calls, and emails.
Yes. Zybo BI can compare business performance across different entities, countries, branches, teams, and service lines, helping management review performance at both local and global levels.
Yes. The Payment Request Dashboard tracks payment requests, estimated costs, actual costs, supplier analysis, charge descriptions, accounts staff workload, and job-level cost visibility.
Yes. Users can apply filters such as entity, date, salesperson, customer, module, shipment type, country, and service. They can also drill down into operational data, customer trends, salesperson KPIs, and shipment movement patterns.
Zybo BI is designed for executive management, operations, finance, accounts, sales, business development, workforce planning teams, and branch or entity managers.
Zybo BI helps reduce dependency on delayed spreadsheets by converting operational and financial data into interactive dashboards. This allows teams to move from reactive reporting to proactive, data-driven management.
Yes. The expected outcome of BI training is that users can navigate dashboards, interpret KPIs, identify bottlenecks, monitor departmental performance, and use dashboards during management meetings.